
Wall Street 101: Breaking Down the Sell-Side and Buy-Side

Having spent my career navigating various roles across Wall Street, I’ve gained firsthand insights into the distinct yet interconnected worlds of the sell-side and buy-side. Each plays a critical role in shaping the financial markets, from evaluating investment opportunities to executing strategies that drive capital allocation. We thought it could be valuable to our audience to share some of these insights. In this primer, we break down what each side does, how they evaluate investment opportunities, and some of the key mechanics of how the industry works. Our goal is to provide a clear and straightforward overview of how these parts of the market come together, and provide investors a behind the scenes view of how the game is really played.
Buy-Side Overview
The buy-side are institutional investors, who manage money for individuals, families, businesses, pensions and endowments. These buy-side institutions include hedge funds, mutual funds, family offices and pension funds, and their primary objective is to invest into different publicly listed companies via stocks, bonds, options or other securities in hopes of driving outsized returns for the outside money they manage. Buy-side investors vary in size, where smaller ones may manage $10M and the largest in the world manage hundreds of billions of dollars. These investors also often manage multiple different funds, where each fund has a different investing strategy that ranges on time horizon, market cap size, industry focus, value or growth, security type and long or short funds. We breakdown the most common funds below.
Long-only funds focus exclusively on buying securities with the expectation that their value will appreciate over time. Their strategy is often to outperform a benchmark index, such as the S&P 500, by selecting stocks or assets they believe are undervalued or have strong growth potential.
Long/short funds, commonly associated with hedge funds, use a more flexible strategy that involves taking long positions in stocks they expect to rise and short positions in stocks they expect to fall. This approach aims to generate returns in both rising and falling markets while managing risk. Long/short strategies can be sector-specific, market-neutral, or directional, depending on the fund’s objectives.
Event-driven funds focus on opportunities arising from corporate events such as mergers, acquisitions, bankruptcies, or restructurings. These funds aim to capitalize on pricing inefficiencies during these events. For example, in merger arbitrage, they may buy shares of the target company and short shares of the acquiring company, profiting from the spread when the deal closes.
Quantitative funds (quant funds) rely on mathematical models and algorithms to make investment decisions. They analyze large datasets to identify patterns or inefficiencies in the market and execute trades systematically. These funds often have high turnover rates and can use long-only or long/short strategies.
Fixed-income funds specialize in bonds and other debt instruments, seeking steady income and preservation of capital. Their strategies range from investing in government and corporate bonds to more complex instruments like mortgage-backed securities or high-yield bonds.
That said, the buy-side can be a high-intense business as investors seek for “alpha” sized returns. Alpha is the excess return of an investment relative to the return of a benchmark index. Each buy-side investment fund has a benchmark they need to outperform on a quarterly and annual basis. The benchmark could be a broader industry index like the S&P 500 or more industry specific like the NASDAQ 100. Portfolio managers that underperform these indexes risk losing their jobs due to the scenario of outflow of capital into other funds or cheaper and often safer index funds.
Buy-Side Hierarchy
The buy-side is structured with a clear hierarchy that helps firms make well-informed investment decisions.
Chief Investment Officer (CIO) sits at the top and sets the overarching strategy and investment philosophy for the firm. The CIO oversees portfolio construction, risk management, and performance, ensuring alignment with the firm's objectives and client expectations. They often act as the final decision-maker for large, strategic investments and allocate resources across different teams.
Portfolio Managers (PMs) are beneath the CIO and are responsible for managing specific funds or portfolios. PMs focus on asset allocation, sector selection, and individual securities, adhering to the firm’s strategy while seeking to outperform benchmarks. They rely heavily on input from their teams to identify investment opportunities and mitigate risks. PMs not only make buy, hold, or sell decisions but also manage portfolio weightings to balance returns and risks.
Analysts form the backbone of the buy-side, providing in-depth analysis and recommendations. They specialize in specific sectors, industries, or asset classes, conducting extensive research, including financial modeling, competitive analysis, and management evaluations. Analysts present their findings to PMs, offering actionable ideas supported by data and insights.
Associates are the entry-level role and support analysts by gathering data, building financial models, and preparing reports. Associates play a vital role in the research process, often doing the groundwork that allows analysts and PMs to focus on higher-level decision-making.
How do institutional investors make investment decisions?
Buy-side investors will decide to invest in a company for a variety of reasons, but the majority all these reasons will be supported by technical analysis, fundamental analysis or combination of both.
Technical analysis is a trading discipline employed to evaluate investments and identify trading opportunities based on “historical” price trends and patterns seen on charts. Day traders, high-turnover hedge funds and quant funds use technical analysis to often make quick trades where they hold positions for very short durations (often less than 24 hours).
Fundamental analysis is a method of measuring a stock's intrinsic value by examining anything that can affect the stock's value. Everything from macroeconomic factors, industry conditions to company specific matters. Fundamental investors are focused on the company’s “fundamentals” such as management team, business model, product roadmap, competitive positioning and most importantly their financials. These investors often have long-term investment horizons that could extend a year to 30+, and are focused on a company’s forward outlook and not historical performance. Like sell-side analysts these investors build detailed financial forecasts to support their investment decisions.
How does the buy-side determine intrinsic value?
To drive “alpha” sized returns, the majority of buy-side institutions lean on fundamental analysis when making investment decisions. They look for stocks where the intrinsic value of a company is lower than the current stock price, but anticipate overtime will appreciate closer to the intrinsic value. However, a company’s intrinsic value is subjective and is determined by the beholder, so unfortunately valuing stocks is sometimes more of an art than science. However, all buy-side investors rely on similar valuation techniques to better determine if a stock is undervalued. The most common valuation techniques used among fundamental investors include relative valuation and intrinsic valuation. Note sell-side analysts adopt similar valuation techniques when it comes to generating price targets and stock recommendations, which we discuss in the Sell-Side Overview section.
Relative valuation techniques are used to value companies by comparing them to other companies in similar industries and with similar business models based on certain metrics. Given the assumption most fundamental investors believe a stock price is based on a company’s future earnings potential, investors will primarily focus on comparing earnings and cash flow financial metrics 2 - 5 years into the future. However, for companies that do not expect to generate positive earnings or cash flow for the foreseeable future, investors can focus on revenue metrics.
That said, when performing a relative analysis an investor can not look at one financial metric and make a decision on its value. In order to compare companies on an apples-to-apples basis, investors will tie in the current market value of the company by using stock price, market capitalization (total market value of the company) and enterprise value (market capitalization minus net cash). By combining current market prices with these financial metrics, investors can get comparable multiples, more formally known as Comps. Most common comp multiples include:
Price-to-Earnings (P/E)
PEG Ratio (Price/Earnings-to-Growth)
Enterprise Value-to-EBITDA (EV/EBITDA)
Price-to-Sales (P/S)
Enterprise Value-to-Sales (EV/Sales)
Price-to-Book (P/B)
Price-to-Cash Flow (P/CF)
Enterprise Value-to-Free Cash Flow (EV/FCF)
The logic behind relative comp analysis is that if similar companies to the company you are valuing are growing at similar rates and have similar profit margins, then the company that’s being valued should be trading at a similar multiple. In contrast, if a company is growing faster or has better profit margins an investor could make the assumption that the company being valued should be trading higher than its comp group. This is when subjectivity enters the equation, because two investors may apply a different multiple to a specific company.
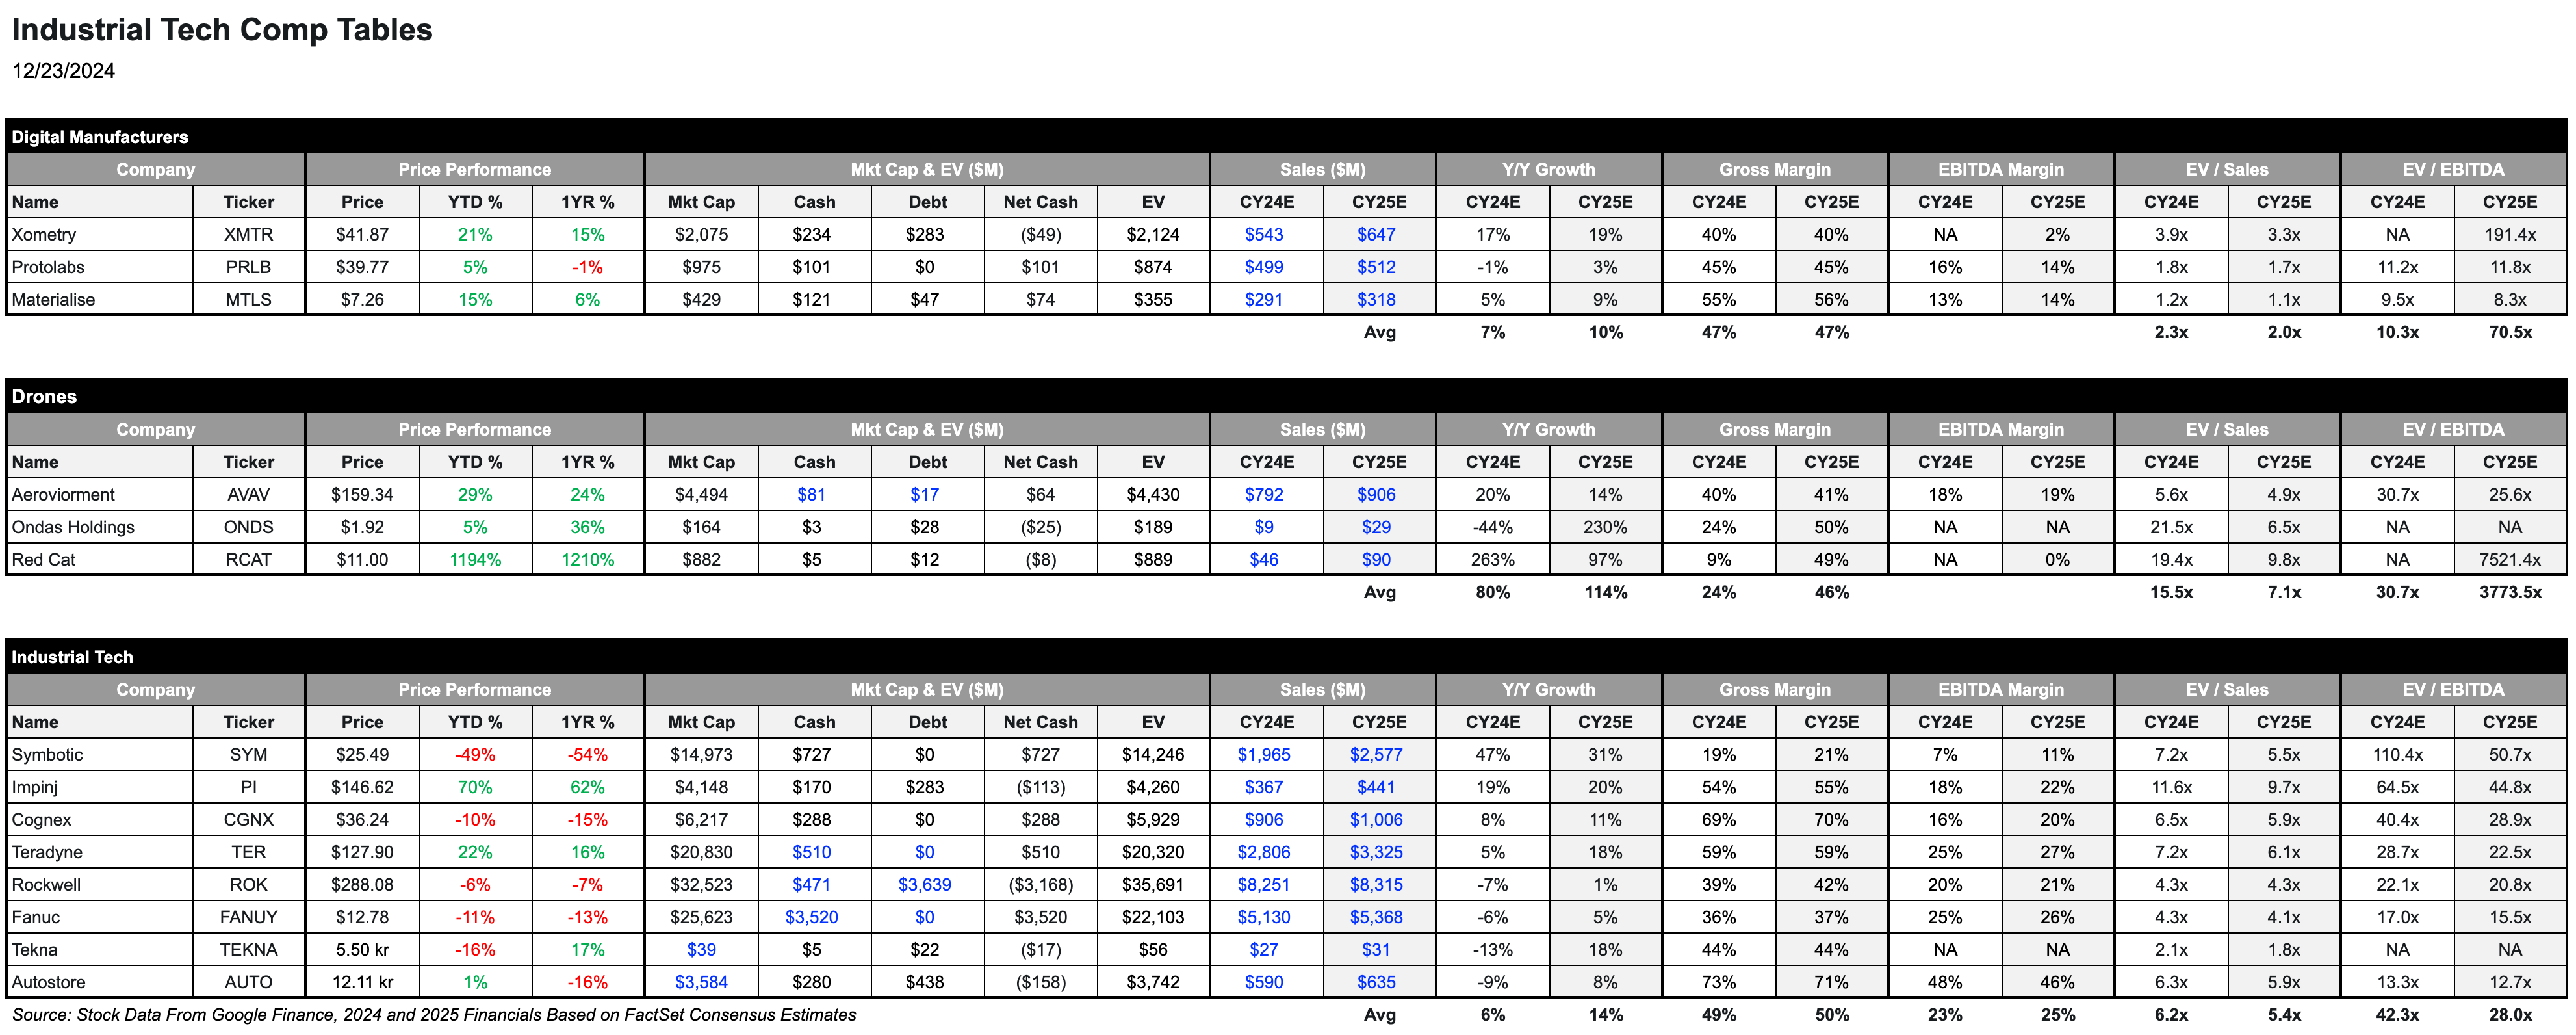
When performing a comp analysis investors will need to create comp tables, which consist of companies in the same industry (i.e. industrial automation) or with similar business models (i.e. software-as-a-subscription). See our industrial automation comp table below. (Note Google Sheets is a great tool to create comp tables with their Google Finance functions.) The financial metrics used in this table are consensus estimates, which is the average estimate of all sell-side analysts covering a specific company. (We dive deeper into consensus estimates in the Sell-Side Overview section below.) The advantages of comps are that they are always current, and it’s easy to find financial information on public companies.
Intrinsic valuation techniques seek to value a business by looking only at the company itself, while relative valuation models seek to value a business by comparing companies to other companies. There are several intrinsic valuation methods available, but the most common is Discounted Cash Flow (DCF) analysis, which calculates the Net Present Value (NPV) of a company’s future cash flow. The pros of a DCF model are that it includes lots of detail about the company’s business, but many assumptions are required, and the company’s value is very sensitive to changes in key variables. This method also works better for companies generating positive cash flow, and more useful in maturer companies. DCF is a more complex topic to cover in this primer, but there are several resources online that could help an investor learn more about this domain.
That said, we believe using both methods when evaluating an investment opportunity is extremely beneficial as it can help solidify investment opportunities. However, note relative and intrinsic valuation techniques are not a guarantee in identifying undervalued assets. However, both methods are used by the smartest investors in the world to make investment decisions everyday.
Follow The Smart Money
Given buy-side investors are trusted to manage trillions of dollars of large corporations cash positions and individuals net worth, they are widely considered the “smart money” as they are the best at what they do. So wouldn’t it be awesome to see what companies the smart money is investing in? Fortunately you can. Under SEC regulation, investment funds that have greater than $100M under management have to disclose their current holdings on a quarterly basis under form 13-F and 13-D. You can look up these forms by going to any public company’s investor relations website page > SEC Filings.
A strategy among buy-side investors and individual retail investors, is to analyze these holdings to spot new investment opportunities. Because of this, it is very common for a stock to see a significant jump if a large buy-side investor, such as Warren Buffett, made a new investment or added to a current position based on a 13-F or 13-D filing. On the contrary, shares may slide materially if a meaningful investor decreased their position or sold out of their position entirely. That said, you need to consider that these filings come out ~45 days after the quarter closes, meaning these investors could have changed their positions since the prior quarter ended.
High Volume & Block Trades An Indicator of Institutional Buying
If investors don’t want to wait for 13-F filings to see institutional activity, they can look for signs of institutional buying or selling within a quarter by analyzing volume spikes and block trades. Unusually high trading volume, especially when paired with price movements, can often indicate that institutions are building or exiting positions. Block trades, which are large, often pre-arranged transactions that can also be executed off-exchange, are another potential clue to institutional activity. However, identifying these moves is challenging because even if you identify a block trade you will not know who is buying, unless you have a “very close” relationship with trading desks. In addition, many block trades are executed through dark pools, where trade details remain hidden until after execution. This lack of transparency makes it difficult to definitively track institutional activity in real-time.
Dark Pools & Why Institutions Use Them
Dark pools are private, off-exchange trading platforms where block trades, can be executed anonymously. Unlike public exchanges, such as the NYSE or NASDAQ, where trade details are visible to all participants, dark pools keep the details of orders, such as price and quantity, hidden until after the trade is completed. These venues are operated by broker-dealers, institutional investors, or independent companies and are primarily used for trading large volumes of shares without affecting the market price. The buy-side uses dark pools to minimize market impact and maintain discretion. When executing a large trade on a public exchange, visibility can lead to price movements as other traders react to the order. Dark pools help the buy-side achieve better pricing by avoiding such moves, preserving the value of the trade, and ensuring that their strategies remain confidential. Despite concerns about transparency, dark pools are an essential tool for institutions managing substantial investments.
Stock Price, Market Cap and Volume Restrictions
Lastly, getting institutions involved in a stock, especially when it’s on the rise, is something many average investors hope for, as institutional buying can create significant upward pricing pressure due to the sheer volume of shares they trade. However, it’s important to note that buy-side institutions often have strict criteria for the stocks they can invest in, including minimum thresholds for market capitalization, trading volume, and stock price. For example, many funds are prohibited from investing in stocks trading below $1, as these are often considered too risky or speculative. While such stocks carry greater risk, they can present opportunities for savvy investors to identify undervalued companies with strong potential. If these stocks rise to a level where they meet institutional criteria, the influx of buy-side involvement could drive the stock price even higher, resulting in substantial gains for early investors.
Investor Gifts
Looking to become a better investor or find that perfect gift for your finance friend?
Check out these products from our partner Investor Gifts.

Sell-Side Overview
If you have ever watched CNBC, you have probably heard an anchor or reporter reference an "analyst." These analysts are more commonly known as sell-side equity research analysts and their role is to provide an unbiased opinion based on proprietary research on a company's stock. Their research, opinions and forward financial projections are primarily targeted toward their buy-side institutional clients to aid in their investment decision. Their opinions and forward financial projections can influence institutional investors' buying behavior and in turn the price of a company’s stock. The number of sell-side analysts covering a given company can vary from 0 to 40+. However, having as much analyst coverage as possible is essential as they play a critical role in creating more awareness among institutional investors. That said, from an investor perspective, it can be beneficial to identify companies with little sell-side coverage as large buy-side investors have yet to maybe identify them as an attractive investment prospect.
To provide meaningful research, analysts need to become industry experts and will focus on covering a list of publicly traded companies in specific industries (i.e. enterprise software, industrial automation, internet, consumer goods, etc), but depending on industry size most analysts cover stocks in multiple industries. To help get a sense of how a company is performing without violating insider information laws, analysts need to build relationships with outside company stakeholders such as customers, suppliers, competitors, and other industry contacts. For example, most companies use independent distribution resellers. Analysts will often talk to these resellers or even survey larger sample sizes, which is referred to as “channel checks”, to get a sense of how demand trends are tracking for a given quarter. However, analysts must get creative to gather proprietary data points, which may include analysts tracking online prices of key goods, surveying consumers around buying trends, and possibly going as far as using satellite imagery to track parking lots at brick and mortar retailers to estimate demand. That said, with the rise of AI, new tools will likely emerge to identify proprietary material data points.
Sell-Side Hierarchy
Sell-side teams are very small and will consist of a senior analyst, and likely one or two associates depending on the size of the senior analysts research coverage.
Senior Analysts are the face of the team, responsible for providing investment recommendations, publishing research reports, and maintaining relationships with institutional clients. They set the research agenda and make high-level decisions about which companies or sectors to cover.
Associates handle much of the groundwork, but play a critical supporting role, gathering data, building financial models, and preparing reports or presentations that feed into the senior analyst's work.
Analyst Research Notes
Analysts will provide their opinion and insights through a research report or commonly known as a “research note”, which will often include commentary on demand trends, new product launches, financial estimates, a price target, and a recommendation as to the stock's expected performance. When an analyst begins covering a company they will initiate coverage through a detailed research note that provides a much broader overview of the company, industry, business model and input on the competitive landscape. After launching coverage, an analyst will publish research notes when they have material proprietary information, as well as key takeaways from earnings results, M&A announcements, material new product launches and non-deal roadshows (we discuss these below in more detail.
Stock Recommendations & Price Targets
Most analysts will use a Buy, Sell or Hold rating to indicate their stock recommendation. These recommendations refer to a stock's performance over a specific duration of time, most commonly 1-year. Share prices can move in the short term, based on the initial recommendation analysts give a stock in their initiation. Furthermore, analysts' perception can change on a company at any time based on macro or company specific factors. Analysts will upgrade or downgrade stocks (i.e. change from a Buy to a Hold) post initiating, which also may affect the share price in the short term.
An analyst stock recommendation will largely be dictated by the analyst's price target. A price target is a price at which an analyst believes a stock to be fairly valued relative to its projected financial results. Most sell-side analysts use the same fundamental valuation techniques as buy-side investors as discussed above.
Consensus Estimates
Sell-side analysts will provide 2 - 5 year financial forecasts. The estimates derived from the models of sell-side analysts are averaged together to come up with a single expectation, which is referred to as consensus. These consensus estimates can be viewed on public websites such as YahooFinance (see below), or financial services like FactSet, Bloomberg or S&PCapital IQ, which is used by both the buy-side and sell-side.
When companies report quarterly results, investors will compare their results to consensus estimates to determine if the quarter was good or bad. Company stocks will often trade higher, when quarterly results exceed expectations, and lower when results fall short. However, many companies provide quarterly and yearly guidance when they report quarterly results to help the analyst community more accurately forecast. Oftentimes despite a company’s current quarterly results, shares will react more heavily to how forward guidance fairs against consensus estimates in future quarters. This is because stocks are valued off their future potential, not historical performance.
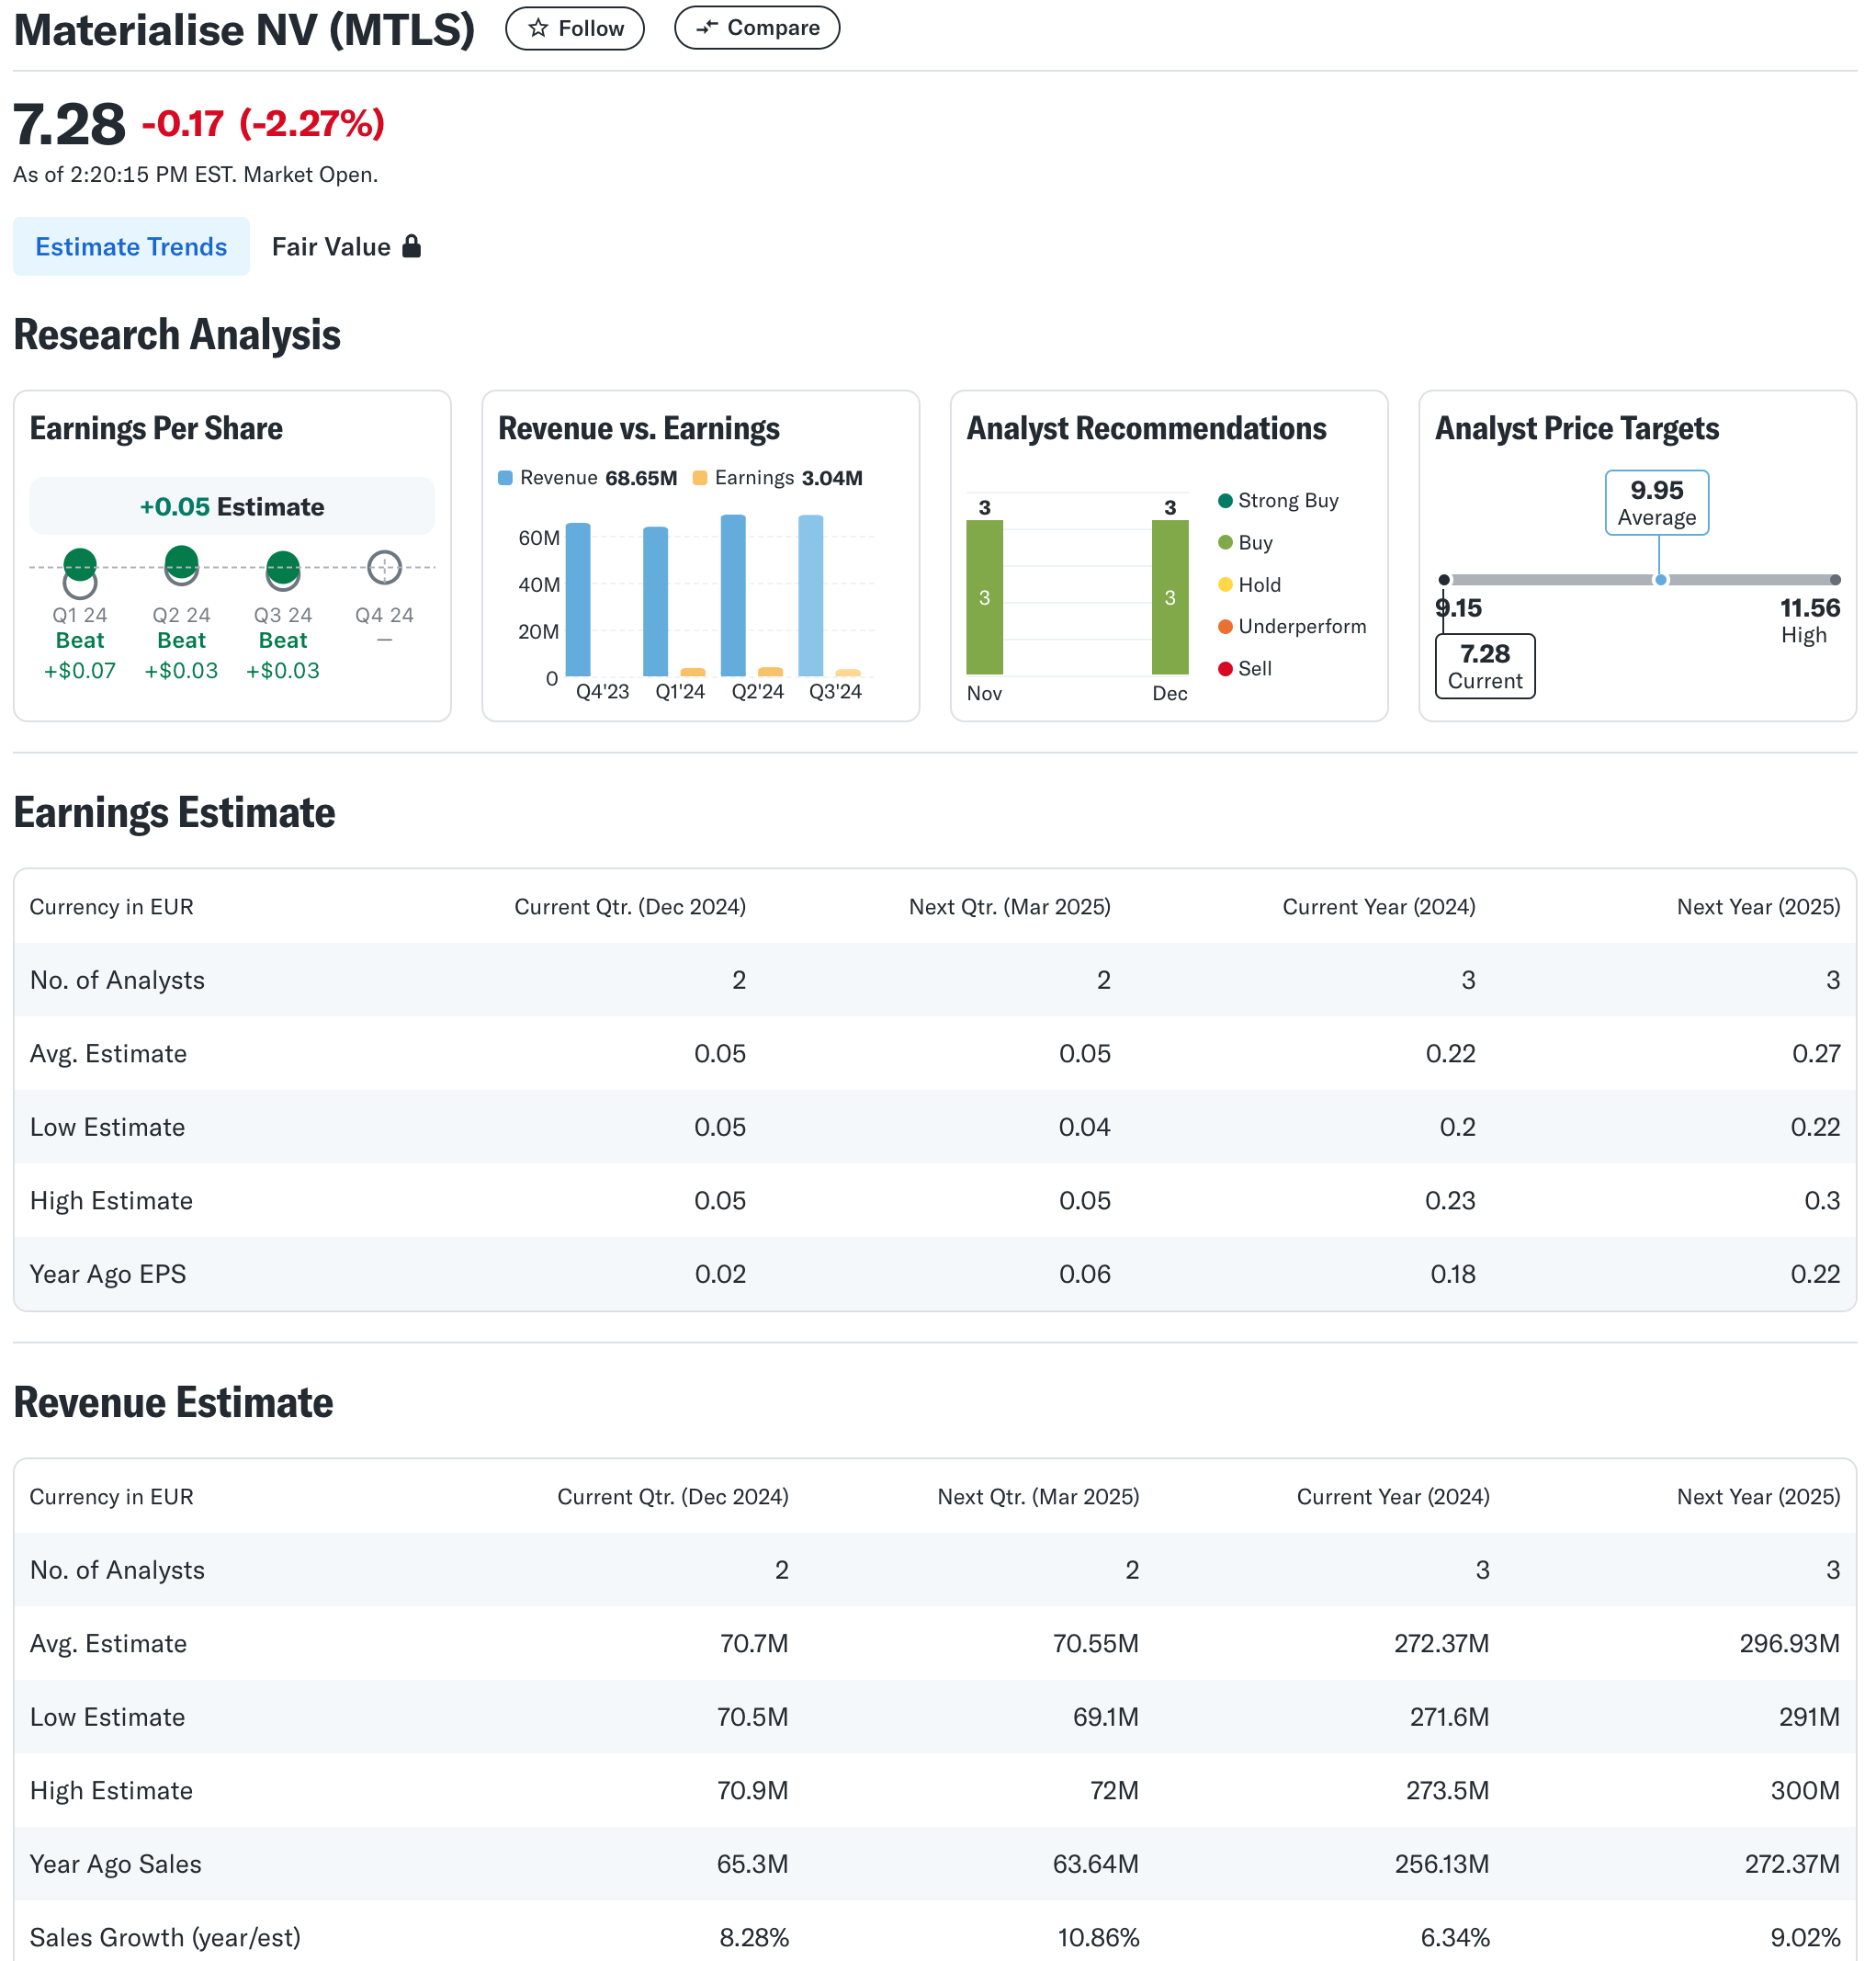
Source: YahooFinance
Whisper Numbers
So if it is important to always beat consensus expectations, why don’t companies just guide very conservatively each quarter and smash consensus estimates? This is not a good practice because if a company is consistently exceeding consensus expectations by a significant amount, investors and analysts will start to have a whisper number. The whisper number is the unofficial expectation of what a quarterly financial release will be. This differs from the official published consensus forecasts, and market prices often react relative to the whisper number. So if a company reports and exceeds expectations and the stock trades down, it maybe because it did not live up to the buy-side whisper number.
Taking Sell-Side Research With A Grain of Salt
Although sell-side analysts are required to accurately represent their true opinion on a given stock and equally disseminate their research, it is a poor practice to take everything an analyst publishes as gospel. For example, because an analyst has a $100 price target on XYZ company, and shares currently trade at $50, does not mean the stock is going to go to $100. Furthermore, just because an analyst has a Buy rating, doesn’t mean they are optimistic on the company’s outlook. Or when a company downgrades a stock from Buy to Hold indicates that they recommend still holding the stock. A downgrade to hold is often viewed as a sell, since most analysts don’t give sell ratings on stocks in order to preserve the relationship with the company as we highlight below. The truth of the matter is buy-side investors largely don’t care about price targets or stock ratings. Rather rely on analysts for financial projections and to get a pulse on demand trends through proprietary methods such as channel checks or other methods. Often in private conversations with the buy-side is where the real truth comes out about their true recommendations on the stock.
So why does an analyst not always voice their honest opinion?
Great question…most sell-side firms have an investment banking division. Investment banking is a huge source of profit for the banks, and if an analyst makes a negative recommendation, the investment banking side of the business may lose that company as a client. Implying it is in the best interest of an analyst to always publish research in a favorable manner. Institutional investors also value one-on-one meetings with company management and will pay those analysts who arrange those meetings, i.e. non-deal roadshow. If an analyst has a negative recommendation on the stock, many companies will not give management access to that analyst.
To help offset conflicts of interest most analysts are paid on a commission + bonus compensation structure. In order to capture higher commissions, the analyst is to convince institutional investors to direct their trading through the trading desk of the analyst's firm. This is accomplished by providing buy-side investors with accurate actionable research. This type of model does largely align with everyone's interest. However, commissions on trades have significantly decreased over the years led by automation technologies. Furthermore, an analyst's bonus is largely dictated by banking deals / pipeline, which highlighted above can impact an analyst's research. Bottom line is when reviewing sell-side research it is important to keep in mind how they are compensated for their research, as it could create a conflict of interest in being fully transparent on their view of the company.
Non-Deal Roadshows & Investor Conferences
A non-deal roadshow is a series of meetings organized by the sell-side, involving a public company’s management team meeting with institutional investors, without the intent to raise capital. (Deal roadshows refer to meetings when companies are raising capital). These roadshows are a key avenue for interaction between the sell-side and buy-side, allowing investors to ask detailed questions and gain insights into a company’s strategy, performance, and outlook. For the average investor, it’s challenging to know when these roadshows occur, but they often take place in the weeks following a company’s earnings report, when management is available to provide additional context on recent results. Said another way, companies typically like to get on the road when they have good news to share…
Similarly, sell-side investor conferences are major platforms where public companies present to investors, often alongside their peers. These events occasionally serve as opportunities for companies to release new material information, such as updated financial guidance or strategic developments, making them significant for investors tracking the stock closely. Fortunately, most public companies participating in these conferences will announce that via press release prior to attending. Some companies will also post the recording of fireside chats or panel discussions to the company’s IR website when attending.
Equity Sales and Their Role On Wall Street
Equity sales teams act as vital intermediaries between the sell-side and buy-side, helping to distribute research, facilitate trades, and maintain client relationships. These teams work closely with sell-side research analysts to communicate actionable insights and investment ideas to institutional investors. Each sell-side firm typically holds an internal meeting around 7 a.m. ET, where research analysts present their latest notes, highlight upgrades or downgrades, and share any new actionable insights or catalysts for specific stocks. The equity sales team then takes this information to the buy-side, tailoring the communication to clients' specific interests or portfolio strategies. By doing so, they ensure that the buy-side has access to timely, relevant information that can influence their investment decisions, strengthening the sell-side's value proposition.
This Is Just The Beginning
We hope this primer has provided readers who were less familiar with the dynamics of Wall Street with a clearer understanding of the roles and interactions between the buy-side and sell-side. While we’ve covered key aspects, the “game” of investing and trading goes far deeper than what is outlined here, involving intricate strategies, nuanced decision-making, and a web of relationships that drive the financial markets. By becoming more educated on how the buy-side and sell-side operate and interact, you can equip yourself with valuable insights to become a better-informed investor, capable of navigating the market with greater confidence and understanding.
Research Disclaimer: We actively write about companies in which we invest or may invest. From time to time, we may write about companies that are in our portfolio. Content on this site including opinions on specific themes and companies in technology, market estimates, and estimates and commentary regarding publicly traded or private companies is not intended for use in making any investment decisions and provided solely for informational purposes. We hold no obligation to update any of our projections and the content on this site should not be relied upon. We express no warranties about any estimates or opinions we make.
I always follow institutional investors in capital markets. My investing philosophy is built around their role in the economy.